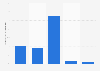
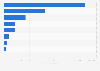
| Service type | Percentage of total Medicare spending |
|---|---|
| - | - |
| - | - |
| - | - |
| - | - |
| - | - |
| - | - |
| - | - |
| - | - |
| - | - |
The chart is not accessible to screen readers. Please switch to the table view to access the data.
Download
Source
Source
Release date
December 2011
More information
Region
United States
Survey time period
2009
Supplementary notes
Numbers may not add to totals because of rounding. Data reflect Medicare spending on personal health care services and products (hospital care, physician services, nursing home care, prescription drugs, etc.) by state of residence. State of residence estimates account for the flow of individuals between states in order to consume health care services and present health spending based on where individuals reside rather than where they receive care.
Citation formats