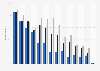
| Characteristic | Helped a lot | Helped somewhat | Hurt somewhat | Hurt a lot | Hasn鈥檛 made much difference |
|---|---|---|---|---|---|
| - | - | - | - | - | - |
| - | - | - | - | - | - |
| - | - | - | - | - | - |
| - | - | - | - | - | - |
| - | - | - | - | - | - |
| - | - | - | - | - | - |
| - | - | - | - | - | - |
| - | - | - | - | - | - |
| - | - | - | - | - | - |
| - | - | - | - | - | - |
| - | - | - | - | - | - |
The chart is not accessible to screen readers. Please switch to the table view to access the data.
November 2012
United States
May 5-17, 2012
n = 650 teachers who know at least a little abotu their students' use of entertainemnt media outside of schoolwork
Online panel
The original question posed by the source was:
"Still thinking about the TV shows, music video games, texting, iPods, cell phone games, social networking sites, apps, computer programs, online videos, and websites your students use for fun, outside of schoolwork: For each of the following, please let me know whether, in your experience, your students鈥� entertainment media use has mainly helped their academic performance, mainly hurt their academic performance, or hasn鈥檛 made much difference one way or the other."
The source does not provide information regarding the percentage points missing to or exceeding 100 percent.