| Characteristic | Percentage of conversation |
|---|---|
| - | - |
| - | - |
| - | - |
The chart is not accessible to screen readers. Please switch to the table view to access the data.
Download
Source
Source
Release date
March 2012
More information
Region
United States
Survey time period
March 5 to 12, 2012
Supplementary notes
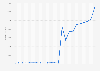
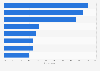
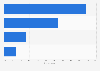
The analysis of the tone of conversation on Twitter utilizes coding procedures created by the Pew Research Center鈥檚 Project for Excellence in Journalism along with computer technology from the media monitoring firm Crimson Hexagon. This analysis is based on an examination of more than 5.4 million tweets related to the Kony 2012 movement.
Citation formats