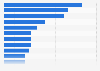
| Leading producer country | 2011 | 2015 |
|---|---|---|
| China | 28 | 23 |
| Australia | 4 | 3 |
| Chile | 3 | 2 |
| South Africa | 1 | 2 |
| D.R. Congo | 1 | 1 |
| Indonesia | 0 | 1 |
| Brazil | 1 | 1 |
| Kazakhstan | 1 | 1 |
| Russia | 3 | 1 |
| Japan | 1 | 1 |
| Rwanda | 1 | 1 |
| United States | 3 | 1 |
| Mexico | 0 | 1 |
| Canada | 2 | 0 |
| Turkey | 1 | 0 |
| Peru | 1 | 0 |
| India | 1 | 0 |
The chart is not accessible to screen readers. Please switch to the table view to access the data.
Loading statistic...
Download
Source
Source
Release date
December 2015
More information
Region
Worldwide
Survey time period
2011 and 2015
Special properties
number of times a country is the leading producer of an elements/element group that is of economic value
Supplementary notes
The following elements were considered in the study: Ag, Al, As, Au, B, Ba, Be, Bi, C (coal, diamond and graphite), Ca, Cd, Cl Co, Cr, Cu, F, Fe, Ga, Ge, He, Hg, I, In, K, L, Mg, Mn, Mo, Na, Nb, Ni, P, Pb, PGE (Ru, Pd, Os, Ir, and Pt), Re, REE (La, Ce, Pr, Nd, Sm, Eu, Gd, Tb, Dy, Ho, Er, Tm, Yb and Lu), S, Sb, Se, Sn, Sr, Ta, Th, Ti, U, V, W, Zn, and Zr.
This statistic was assembled using more than one edition of the report from the source.
Citation formats