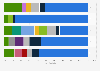
| Commodity | Australia | Brazil | Canada | Chile | China | Congo | India | Indonesia | Peru | Philippines | Russia | South Africa | United States |
|---|---|---|---|---|---|---|---|---|---|---|---|---|---|
| - | - | - | - | - | - | - | - | - | - | - | - | - | - |
| - | - | - | - | - | - | - | - | - | - | - | - | - | - |
| - | - | - | - | - | - | - | - | - | - | - | - | - | - |
| - | - | - | - | - | - | - | - | - | - | - | - | - | - |
| - | - | - | - | - | - | - | - | - | - | - | - | - | - |
The chart is not accessible to screen readers. Please switch to the table view to access the data.
Download
Source
Sources
Release date
June 2020
More information
Region
Worldwide
Survey time period
2019
Supplementary notes
* The statistics are based on the aggregated data of the top 40 mining companies worldwide by market capitalization for the respective years. These companies dominate much of the world market, so they can be considered as representing the industry as a whole.
Citation formats