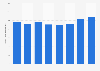
| Characteristic | Additions in gigawatts |
|---|---|
| - | - |
| - | - |
| - | - |
| - | - |
| - | - |
| - | - |
| - | - |
| - | - |
| - | - |
| - | - |
| - | - |
| - | - |
The chart is not accessible to screen readers. Please switch to the table view to access the data.
Download
Source
Source
Release date
September 2016
More information
Region
United States
Survey time period
1985 to 2015
Supplementary notes
* The figures for 2016 through 2040 are forecasts. According to the source, the projection is a business-as-usual trend estimate, given known technology and technological and demographic trends. Figures prior to 2000 are taken from previous reports.
Citation formats