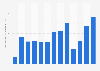
| Characteristic | Percentage of respondents |
|---|---|
| Any gambling activity (f) | 73% |
| National Lottery Draw | 59% |
| Another lottery | 25% |
| Scratchcards | 24% |
| Horse races (b) | 16% |
| Slot machines | 13% |
| Any other online gambling (e) | 13% |
| Private betting | 11% |
| Sports betting (b) | 9% |
| Bingo (a) | 9% |
| Casino games (c) | 5% |
| Any online betting (d) | 4% |
| Football pools | 4% |
| Dog races (b) | 4% |
| Betting on non-sports events (b) | 4% |
| Fixed odds betting terminals | 4% |
| Online slot machine style games/instant wins | 3% |
| Poker at a pub/club | 2% |
| Spread betting | 1% |
The chart is not accessible to screen readers. Please switch to the table view to access the data.
February 2011
United Kingdom
2010
7,756 respondents
16 years and older
Living in private households in England, Scotland and Wales
Computer-assisted personal interviews (CAPI)
* Multiple answers were possible. The source does not provide detailed information regarding the question.
(a) Includes bingo played at a club or online (the prevalence of playing bingo online was less than 1%).
(b) Includes bets made online, by telephone, or in person, with a bookmaker or a betting exchange.
(c) Includes casino games (such as roulette, poker , blackjack) played in a casino or online (prevalence rates of playing casino games online in the last year was 3% overall).
(d) Includes online bets on horse races, dog races, other sports or non-sports events with a bookmaker or betting exchange.
(e)
Includes using the internet to play the National Lottery, other lotteries, bingo, football pools, casino
games, online slot machine style games.