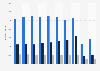
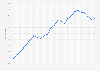
| Transit agency City and state name | Thousand passenger miles |
|---|---|
| - | - |
| - | - |
| - | - |
| - | - |
| - | - |
| - | - |
| - | - |
| - | - |
| - | - |
| - | - |
The chart is not accessible to screen readers. Please switch to the table view to access the data.
Download
Source
Sources
Release date
May 2013
More information
Region
United States
Survey time period
2011
Supplementary notes
Includes only transit agencies reporting to Federal Transit Administration FY 2009 National Transit Database.
Data are collected and calculated for report years. A report year is each transit agency's fiscal year that ends during a calendar year.
Citation formats