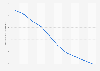
| Characteristic | Total | Pedestrian |
|---|---|---|
| 2022 | 42,514 | 7,552 |
| 2021 | 42,939 | 7,388 |
| 2020 | 39,007 | 6,565 |
| 2019 | 36,355 | 6,272 |
| 2018 | 36,835 | 6,374 |
| 2017 | 37,473 | 6,075 |
| 2016 | 37,806 | 6,080 |
| 2015 | 35,485 | 5,495 |
| 2014 | 32,744 | 4,910 |
| 2013 | 32,894 | 4,779 |
| 2012 | 33,782 | 4,818 |
| 2011 | 32,479 | 4,457 |
| 2010 | 32,999 | 4,302 |
| 2009 | 33,883 | 4,109 |
| 2008 | 37,423 | 4,414 |
| 2007 | 41,259 | 4,669 |
| 2006 | 42,708 | 4,795 |
| 2005 | 43,510 | 4,892 |
| 2004 | 42,836 | 4,675 |
| 2003 | 42,884 | 4,774 |
| 2002 | 43,005 | 4,851 |
| 2001 | 42,196 | 4,901 |
The chart is not accessible to screen readers. Please switch to the table view to access the data.
Loading statistic...
Download
Source
Source
Release date
July 2024
More information
Region
United States
Survey time period
2001 to 2022
Supplementary notes
The figures for 2001 to 2012 were taken from a previous edition of the publication.
Pedestrians are defined as any person on foot, walking, running, jogging, hiking, sitting or lying down who are involved in a motor vehicle traffic crash. A traffic crash is an incident that involves one or more vehicles where at least one vehicle is in-transport and the crash originates on a public traffic way.
Citation formats