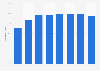
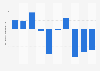
| Household income (in U.S. dollars) | Less than $30,000 | $30,000 - $49,999 | $50,000 - $74,999 | $75,000 and more |
|---|---|---|---|---|
| - | - | - | - | - |
| - | - | - | - | - |
| - | - | - | - | - |
| - | - | - | - | - |
| - | - | - | - | - |
| - | - | - | - | - |
| - | - | - | - | - |
| - | - | - | - | - |
| - | - | - | - | - |
The chart is not accessible to screen readers. Please switch to the table view to access the data.
April 2021
United States
Jan 25 - Feb 8, 2021
1,502 respondents
18 years and older
Telephone interview
*No data available for 2018
鈥淪martphone ownership鈥� includes those who say their phone is a smartphone, or who describe their phone as running on the Android, Blackberry, iPhone, Palm or Windows platforms.
For 2011 data, n=2,277 adults ages 18 and older, including 755 interviews conducted on respondent鈥檚 cell phone.
For 2012 data, n=2,253 adults and survey includes 901 cell phone interviews. Both 2011 and 2012 data include Spanish-language interviews.
For 2013 data, n=2,252 adults and survey includes 1,127 cell phone interviews in English and Spanish.
2014 - n = 2,001
2015 - n = 2,188
Source did not provide information for the number of respondents in 2016 and 2017