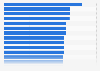
| Characteristic | Home attendance |
|---|---|
| - | - |
| - | - |
| - | - |
| - | - |
| - | - |
| - | - |
| - | - |
| - | - |
| - | - |
| - | - |
| - | - |
| - | - |
| - | - |
| - | - |
| - | - |
| - | - |
| - | - |
| - | - |
| - | - |
| - | - |
| - | - |
| - | - |
| - | - |
| - | - |
| - | - |
| - | - |
| - | - |
| - | - |
| - | - |
| - | - |
| - | - |
| - | - |
The chart is not accessible to screen readers. Please switch to the table view to access the data.
Download
Source
Source
Release date
January 2011
More information
Region
United States
Survey time period
2010
Supplementary notes
* The figure for the San Francisco 49ers includes only seven home games. The game against the Denver Broncos was not played at Candlestick Park but at Wembley Stadium in London, England.
The figure for the Buffalo Bills includes only seven home games. The game against the Chicago Bears was not played at Buffalo's home venue but in Toronto.
Citation formats