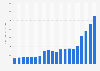
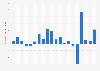
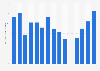
| Characteristic | Player expenses in million U.S. dollars |
|---|---|
| - | - |
| - | - |
| - | - |
| - | - |
| - | - |
| - | - |
| - | - |
| - | - |
| - | - |
| - | - |
| - | - |
| - | - |
| - | - |
| - | - |
| - | - |
| - | - |
| - | - |
| - | - |
| - | - |
| - | - |
The chart is not accessible to screen readers. Please switch to the table view to access the data.
Download
Source
Source
Release date
December 2025
More information
Region
Canada
Survey time period
2005/06 to 2025
Supplementary notes
Includes benefits and bonuses.
*Due to a lockout, caused by a labor dispute, the 2012/13 NHL season was shortened to 48 games per team, down from 82 originally scheduled games.
Citation formats