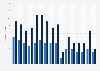
| Characteristic | Highway | Nonhighway | Aircraft | Pedestrian struck by vehicle | Water vehicle | Railway |
|---|---|---|---|---|---|---|
| 20 | 1,038 | 206 | 80 | 330 | 74 | 32 |
| 19 | 1,270 | 236 | 152 | 341 | 63 | 47 |
| 18 | 1,276 | 225 | 133 | 325 | 58 | 48 |
| 17 | 1,299 | 209 | 126 | 313 | 68 | 48 |
| 16 | 1,252 | 245 | 130 | 342 | 48 | 50 |
| 15 | 1,264 | 253 | 139 | 289 | 44 | 50 |
| 14 | 1,157 | 248 | 135 | 318 | 55 | 57 |
| 13 | 1,099 | 227 | 136 | 294 | 60 | 41 |
| 12 | 1,153 | 233 | 127 | 293 | 63 | 38 |
| 11 | 1,103 | 222 | 145 | 316 | 72 | 50 |
| 10 | 1,044 | 276 | 152 | 280 | 60 | 45 |
| 09 | 985 | 261 | 159 | 268 | 86 | 34 |
| 08 | 1,215 | 284 | 191 | 329 | 76 | 34 |
| 07 | 1,414 | 296 | 174 | 345 | 71 | 49 |
| 06 | 1,356 | 345 | 217 | 379 | 96 | 65 |
| 05 | 1,437 | 340 | 149 | 391 | 88 | 83 |
| 04 | 1,398 | 338 | 231 | 378 | 91 | 50 |
| 03 | 1,353 | 347 | 211 | 337 | 69 | 43 |
| 02 | 1,373 | 323 | 194 | 356 | 71 | 64 |
| 01 | 1,409 | 326 | 247 | 383 | 90 | 62 |
| 00 | 1,365 | 399 | 280 | 370 | 84 | 71 |
| 99 | 1,496 | 352 | 228 | 377 | 102 | 56 |
| 98 | 1,442 | 388 | 224 | 413 | 112 | 60 |
| 97 | 1,393 | 377 | 261 | 367 | 109 | 93 |
| 96 | 1,346 | 374 | 324 | 353 | 119 | 74 |
| 95 | 1,346 | 387 | 283 | 388 | 87 | 82 |
| 94 | 1,343 | 409 | 426 | 391 | 94 | 81 |
| 93 | 1,242 | 392 | 282 | 365 | 119 | 86 |
| 92 | 1,158 | 436 | 353 | 346 | 109 | 66 |
The chart is not accessible to screen readers. Please switch to the table view to access the data.
March 2022
United States
1992 to 2020
Based on the 1992 Bureau of Labor Statistics, Occupational Injury and Illness Classification Manual.
Data do not include fatalities from the terrorist attacks of September 11, 2001 which totaled 2,886.
Highway: Includes collisions between vehicles/mobile equipment moving in the same or opposite directions, such as in an intersection; between moving and standing vehicles/mobile equipment at the side of a roadway; or a vehicle striking a stationary object. Also includes non-collisions, e.g., jack-knifed or overturned vehicle/mobile equipment-no collision; ran off highway-no collision; struck by shifting load; sudden start or stop; not elsewhere classified.
Nonhighway: Refers to farms and industrial premises. Includes collisions between vehicles/mobile equipment; vehicles/mobile equipment striking a stationary object. Also includes noncollisions such as a fall from a moving vehicle/mobile equipment, fall from and struck by vehicle/mobile equipment, overturned vehicle/mobile equipment, and loss of control of vehicle/mobile equipment.
Pedestrian struck by vehicle: Includes worker struck by vehicle/mobile equipment in roadway, on side of road, in a parking lot, or non-road area.
Water vehicle: Includes collisions, explosions, fires, fall from or on ship/boat, and sinking/capsized water vehicles involved in transportation. Does not include fishing boats.
Railway: Includes collisions between railway vehicles, railway vehicle and other vehicle, railway vehicle and other object, and derailment.
The categories do not define the types of jobs people had, nor the industries in which they worked. The categories define the ways in which they died. For example, a representative travelling for business reasons who is killed in a rail accident would be listed under rail.