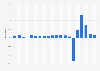
| Year | U.S. passenger-miles in billions |
|---|---|
| 2021 | 573.38 |
| 2020 | 306.12 |
| 2019 | 762.84 |
| 2018 | 730.43 |
| 2017 | 693.82 |
| 2016 | 670.44 |
| 2015 | 641.91 |
| 2014 | 607.77 |
| 2013 | 589.69 |
| 2012 | 580.5 |
| 2011 | 575.61 |
| 2010 | 564.69 |
| 2009 | 551.74 |
| 2008 | 583.29 |
| 2007 | 607.56 |
The chart is not accessible to screen readers. Please switch to the table view to access the data.
Loading statistic...
Download
Source
More information
Region
United States
Survey time period
2007 to 2021
Supplementary notes
To retrieve the data click T1: U.S. Air Carrier Airport Activity Statistics,select Analysis from the Carrier Region row and select Time Series as the Analysis Type.
Air carrier passenger-miles are computed by summing the products of the aircraft-miles flown on each inter airport segment multiplied by the number of passengers carried on that segment.
Air traffic includes air carriers (certificated, domestic, all services) and general aviation (all operations other than those operating under 14 CFR and 14 CFR 135).
Values have been rounded.
Citation formats