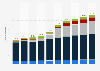
| Characteristic | Capacity factor |
|---|---|
| Nuclear | 92.3% |
| Geothermal | 65% |
| Natural gas - combined cycle | 59.7% |
| Other biomass | 59% |
| Wood | 55.6% |
| Other fossil fuels | 45.5% |
| Coal | 42.6% |
| Hydroelectric | 34.5% |
| Wind | 34.3% |
| Solar thermal | 24.6% |
| Solar photovoltaic | 23.4% |
| Natural gas - steam turbine | 20.5% |
| Natural gas - internal combustion | 20.2% |
| Natural gas - gas turbine | 14.7% |
| Pumped storage* | 11.3% |
| Petroleum - steam turbine | 8.5% |
| Battery* | 7.5% |
| Petroleum - internal combustion | 2.1% |
| Petroleum - gas turbine | 2.1% |
The chart is not accessible to screen readers. Please switch to the table view to access the data.
Loading statistic...
Download
Source
Source
Release date
April 2025
More information
Region
United States
Survey time period
2024
Special properties
Provisional figures
Supplementary notes
*Values for battery and pumped storage refer to usage factors, i.e. the ratio between gross generation with available capacity. It contrasts to the other sources, which consider net generation.
Citation formats