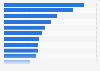
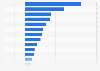
| Characteristic | Number of visits in millions |
|---|---|
| - | - |
| - | - |
| - | - |
| - | - |
| - | - |
| - | - |
| - | - |
| - | - |
| - | - |
| - | - |
| - | - |
| - | - |
| - | - |
| - | - |
| - | - |
The chart is not accessible to screen readers. Please switch to the table view to access the data.
Download
Source
Source
In cooperation with
Semrush
Release date
July 2026
More information
Region
United States
Survey time period
June 2026
Supplementary notes
Release date represents the date figures were accessed.
The source specifies the following: Traffic data is extracted from the Traffic & Market Toolkit, enriched with extensive clickstream data. Additionally, Semrush applies its own AI algorithms to gather, clean, and analyze this colossal amount of raw data, thereby mapping the online journey of more than 200 million real, albeit anonymous, users.
Citation formats