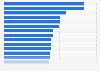
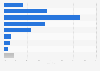
| Characteristic | ED visit time in minutes |
|---|---|
| - | - |
| - | - |
| - | - |
| - | - |
| - | - |
| - | - |
| - | - |
| - | - |
The chart is not accessible to screen readers. Please switch to the table view to access the data.
Download
Source
Source
Release date
May 2026
More information
Region
United States
Survey time period
2018 to 2025
Number of respondents
4,000+ Medicare-certified hospitals
Supplementary notes
*Average (median) time all patients spent in the emergency department before leaving the visit, including psychiatric/mental health patients and patients who were transferred to another facility.聽
12-month data as of June every year, except for the year 2020 (12-month data as of September)
Citation formats