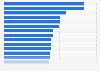
| Characteristic | Visit rate per 100 people |
|---|---|
| - | - |
| - | - |
| - | - |
| - | - |
| - | - |
The chart is not accessible to screen readers. Please switch to the table view to access the data.
Download
Source
Source
Release date
August 2024
More information
Region
United States
Survey time period
2022
Number of respondents
16,207 respondents
Special properties
emergency department (ED) visits
Supplementary notes
* Medicaid, CHIP, and other state-based programs.
The source adds the following information: " Data are based on a sample of 16,025 emergency department visits by patients in 2022, representing about 155 million emergency department visits. Visit rates are based on a patient鈥檚 primary expected source of payment and proportional insurance data from the 2022 National Health Interview Survey"
Citation formats