| Month | 2020 | 2021 | 2022 | 2023 | 2024 | 2025 |
|---|---|---|---|---|---|---|
| - | - | - | - | - | - | - |
| - | - | - | - | - | - | - |
| - | - | - | - | - | - | - |
| - | - | - | - | - | - | - |
| - | - | - | - | - | - | - |
| - | - | - | - | - | - | - |
| - | - | - | - | - | - | - |
| - | - | - | - | - | - | - |
| - | - | - | - | - | - | - |
| - | - | - | - | - | - | - |
| - | - | - | - | - | - | - |
| - | - | - | - | - | - | - |
The chart is not accessible to screen readers. Please switch to the table view to access the data.
Download
Source
Source
Release date
June 2025
More information
Region
Mexico
Survey time period
January 2020 - June 2025
Supplementary notes
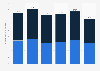
Search interest index for the term "Airbnb," where 100 reflects the highest level of interest since January 2019. According to the source: "The numbers reflect search interest relative to the maximum value on a chart in a specific region and time period. A value of 100 indicates the maximum popularity of a term, while 50 and 0 indicate that a term is half as popular relative to the maximum value or that there was not enough data for the term, respectively."
Citation formats