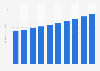
| Characteristic | Percentage of French people consuming tap water* | Percentage of French people consuming bottled water* |
|---|---|---|
| 2005 | 56% | 59% |
| 2006 | 60% | 52% |
| 2007 | 63% | 48% |
| 2008 | 65% | 44% |
| 2010 | 67% | 42% |
| 2011 | 65% | 47% |
| 2012 | 69% | 43% |
| 2013 | 65% | 51% |
| 2014 | 66% | 48% |
| 2015 | 66% | 47% |
| 2016 | 64% | 51% |
| 2017 | 67% | 52% |
| 2018 | 65% | 51% |
| 2020 | 67% | 50% |
| 2021 | 68% | 48% |
| 2022 | 68% | 47% |
The chart is not accessible to screen readers. Please switch to the table view to access the data.
Loading statistic...
Download
Source
Sources
Release date
April 2023
More information
Region
France
Survey time period
2005 - 2008; 2010 - 2022
Number of respondents
3,467 respondents
Age group
18 years and older
Method of interview
Online interview
Supplementary notes
*The data correspond to the proportion of respondents who reported drinking "every day or almost every day" tap or bottled water.
The sample consists of 3,467 individuals aged 18 and over, drawn from a nationally representative sample of the metropolitan French population. Quotas were applied (gender, age, occupation, and socio-professional category of the head of household) and stratification was done (UDA 13 regions, type of urban area).
Citation formats