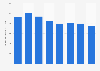
| Characteristic | CO2 equivalent emissions in million metric tons |
|---|---|
| - | - |
| - | - |
| - | - |
| - | - |
| - | - |
| - | - |
| - | - |
| - | - |
| - | - |
| - | - |
The chart is not accessible to screen readers. Please switch to the table view to access the data.
Download
Source
Source
In cooperation with
Ember
Release date
July 2025
More information
Region
Asia, APAC
Survey time period
2024
Special properties
CO2 equivalent emissions
Supplementary notes
*2023 figures
Release date refers to the date of access.
Figures account for full lifecycle emissions, including upstream methane, supply chain, and manufacturing-related emissions. All greenhouse gases are converted into carbon dioxide equivalents (CO鈧俥) over a 100-year timescale.
Citation formats