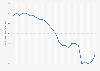
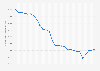
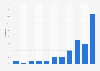
| Characteristic | Number of average available hospital beds |
|---|---|
| 2010/11 | 1,149,628 |
| 2011/12 | 1,169,784 |
| 2012/13 | 1,184,494 |
| 2013/14 | 1,205,805 |
| 2014/15 | 1,227,785 |
| 2015/16 | 1,238,780 |
| 2016/17 | 1,227,493 |
| 2017/18 | 1,205,839 |
| 2018/19 | 1,219,060 |
| 2019/20 | 1,235,656 |
| 2020/21 | 870,067 |
| 2021/22 | 1,061,086 |
| 2022/23 | 1,102,231 |
| 2023/24* | 1,148,179 |
The chart is not accessible to screen readers. Please switch to the table view to access the data.
Loading statistic...
Download
Source
Source
Release date
September 2024
More information
Region
United Kingdom (Scotland)
Survey time period
2010/11 to 2023/24
Supplementary notes
This statistic is compiled from multiple reports from the same source found .听
*Provisional figures.
The source adds the following information: "For these analyses, and in the context of this publication, hospital admissions are defined as the number of continuous inpatient stays (CIS) in hospital where the patient was admitted."
Citation formats