| Characteristic | Decrease total staff level | Maintain total staff level | Increase total staff level | Don't know |
|---|---|---|---|---|
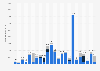
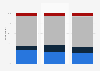
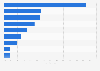
| Overall | 18% | 52% | 25% | 5% |
| Retail | 30% | 55% | 11% | 4% |
| Non-compulsory education | 27% | 46% | 20% | 7% |
| Public administration and other public sector | 24% | 42% | 28% | 5% |
| Wholesale and real estate | 24% | 51% | 20% | 6% |
| Compulsory education (including pre-primary) | 23% | 65% | 9% | 3% |
| Primary and utilities* | 23% | 50% | 27% | 1% |
| Human health activities | 21% | 47% | 23% | 9% |
| Hotels, catering and restaurants | 20% | 46% | 28% | 5% |
| Manufacturing | 19% | 54% | 22% | 4% |
| Voluntary | 19% | 58% | 20% | 3% |
| Administrative and support service activities and other service activities | 17% | 53% | 24% | 6% |
| Finance and insurance | 15% | 44% | 34% | 7% |
| Transport and storage | 13% | 43% | 36% | 7% |
| Legal, accounting, consultancy and activities of head offices | 10% | 46% | 39% | 5% |
| Other professional, scientific and technical activities | 10% | 57% | 29% | 4% |
| Care, social work and other healthcare activities | 8% | 56% | 31% | 5% |
| Construction | 8% | 60% | 27% | 4% |
| Information and communication | 7% | 42% | 48% | 3% |
| Arts, entertainment and recreation | 5% | 64% | 26% | 5% |
The chart is not accessible to screen readers. Please switch to the table view to access the data.
Loading statistic...
Download
Source
Source
Release date
May 2025
More information
Region
United Kingdom
Survey time period
March 24 to April 15, 2025*
Number of respondents
2,004*
Special properties
Senior HR professionals and decision-makers in the UK
Method of interview
Online survey
Supplementary notes
*Date and survey count for most recent survey
Citation formats