

| Characteristic | Share of respondents |
|---|---|
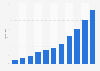
| 2007 | 54% |
| 2008 | 46% |
| 2009 | 34% |
| 2010 | 47% |
| 2011 | 58% |
| 2012 | 50% |
| 2013 | 50% |
| 2014* | 54% |
| 2015 | 55% |
| 2016 | 66% |
| 2017 | 67% |
| 2018 | 82% |
| 2019 | 83% |
| 2020 | 70% |
| 2021 | 65% |
| 2022 | 74% |
| 2023 | 70% |
| 2025 | 85% |
The chart is not accessible to screen readers. Please switch to the table view to access the data.
Loading statistic...
Download
Source
Source
In cooperation with
Bitkom
Release date
August 2025
More information
Region
Germany
Survey time period
Calendar weeks 33 to 27, 2025
Number of respondents
855 respondents
Special properties
Companies with at least three employees
Method of interview
Computer-assisted telephone interviews (CATI)
Supplementary notes
* Only ITC companies surveyed until 2014.聽
The source includes a note for the following question: "How do you assess the current availability of IT specialists on the job market?" - "There is a shortage of IT specialists."
Citation formats



