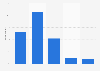
| Characteristic | Share of respondents |
|---|---|
| - | - |
| - | - |
| - | - |
| - | - |
| - | - |
| - | - |
| - | - |
| - | - |
| - | - |
| - | - |
| - | - |
| - | - |
The chart is not accessible to screen readers. Please switch to the table view to access the data.
May 2024
Africa, South Africa
October to December, 2023
3,511 respondents
18 years and older
interviews conducted in the homes and home languages of respondents
Face-to-face interview
The source asked in a survey why a respondent would choose a specific party in the 2024 election, they could offer up to five reasons.
Ipsos Public Affairs conducted the field work. A nationally representative sample of 3 600 respondents was taken by Ipsos and arranged by province and smaller geographic and settlement features. At a 鈥渟mall place鈥� level probability proportionate to size (PPS) was used to determine sample points. Close to each sample point, six interviews were conducted, as directed by Ipsos鈥檚 Marketing Science team. Households were chosen at random and the person to be interviewed within a household was also chosen at random, ensuring age, gender and race representation. Three efforts (including weekend and evening calls) were made to secure an interview with the chosen respondent. The sample informing the analysis for this study was 3,511. Five questions with options were included in Ipsos鈥檚 Khayabus survey.
The source states that the error margin of the survey at a 95% confidence interval is a maximum of plus or minus 1.8% (Ipsos, 2024). The descriptive statistics and the cross tabulations were weighted to the national population. At the time the survey was conducted, the uMkhonto weSizwe Party (MK) was not registered, and therefore not included in the party choice in the survey.聽
Other details of the survey: 51% of the participants were women and 49% men. 67% live in urban areas and 33% live in rural parts of the country. The majority of聽 the sample consists of young people, with 51% aged 18鈥�34 years, 41% aged 35鈥�60 years, and 8% older than 60 years. Regarding racial composition, 9% is white, 79% black African, 3% Indian/Asian and 10% colored. Those who are working accounted for 43%, those who are not active economically comprised of 20%, and 37% are unemployed (includes jobseekers and discouraged workers and receiving social grants. Respondents who disclosed their income and earned less than R8 000 a month made up 45% of the sample, and about 14% earn more than R10 000 a month. Those who refused to disclose their income made up 37%.
Considering the level of education of the total sample size:
No schooling: 0.9%
Some primary schooling: 2.6%聽
Completed primary school: 3.4%
Some high school education: 28.2%
Completed matric (Grade 12 - final year of high school): 49.3%
Tertiary education qualification with a Technikon diploma or degree: 9%
聽University degree: 4.5%聽 聽S
Some other post-matric qualification: 1.4%聽