| Characteristic | 16-24 years | 25-34 years | 35-44 years | 45-54 years | 55+ years |
|---|---|---|---|---|---|
| - | - | - | - | - | - |
| - | - | - | - | - | - |
| - | - | - | - | - | - |
| - | - | - | - | - | - |
| - | - | - | - | - | - |
| - | - | - | - | - | - |
| - | - | - | - | - | - |
| - | - | - | - | - | - |
The chart is not accessible to screen readers. Please switch to the table view to access the data.
Download
Source
Source
In cooperation with
Rakuten Insight
Release date
April 2024
More information
Region
South Korea
Survey time period
March 14 to 31, 2024
Number of respondents
1,640 respondents
Age group
16 years and older
Special properties
among those who used shared mobility services
Supplementary notes
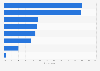
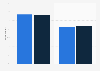
Original question: "What kind of shared mobility services do you use the most? (Choose up to 3 of the most relevant answers)"
Respondent counts for age groups are as follows:
16-24 years: 71 respondents
25-34 years: 381 respondents
35-44 years: 470 respondents
45-54 years: 448 respondents聽
55 years or older: 270 respondents
Citation formats