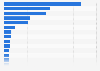
| Characteristic | Distribution of customers |
|---|---|
| - | - |
| - | - |
| - | - |
| - | - |
The chart is not accessible to screen readers. Please switch to the table view to access the data.
Download
Source
Source
Release date
February 2023
More information
Region
India
Survey time period
2023
Supplementary notes
This distribution is for customers with ticket size of less than 10,000 Indian rupees.
Tier 1 cities have a population of 100,000 or above.
Tier 2 cities have a population of 50,000 to 99,999.
Tier 3 cities have a population of 20,000 to 49,999.
Tier 4 cities have a population of 10,000 to 19,999.
Citation formats