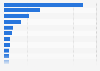
| Characteristic | Electric power sector* | End-use sectors** |
|---|---|---|
| - | - | - |
| - | - | - |
| - | - | - |
| - | - | - |
| - | - | - |
| - | - | - |
| - | - | - |
| - | - | - |
| - | - | - |
| - | - | - |
| - | - | - |
| - | - | - |
| - | - | - |
| - | - | - |
| - | - | - |
| - | - | - |
| - | - | - |
| - | - | - |
| - | - | - |
| - | - | - |
| - | - | - |
| - | - | - |
| - | - | - |
| - | - | - |
| - | - | - |
| - | - | - |
| - | - | - |
The chart is not accessible to screen readers. Please switch to the table view to access the data.
Download
Source
Source
Release date
April 2025
More information
Region
United States
Survey time period
2024
Special properties
Net summer capacity
Supplementary notes
*Includes electricity-only and combined-heat-and-power plants that have a regulatory status.聽
**Includes electricity-only plants in the commercial and industrial sectors that have a non-regulatory status. Also includes small on-site generating systems in the residential, commercial, and industrial sectors used primarily for own-use generation.
Figures do not include off-grid sector photovoltaics.
In the EIA reference case projection, a business-as-usual trend is estimated, given known technology and technological and demographic trends.
Citation formats