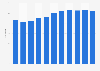
| Characteristic | Total number of properties |
|---|---|
| - | - |
| - | - |
| - | - |
| - | - |
| - | - |
| - | - |
| - | - |
| - | - |
| - | - |
| - | - |
| - | - |
| - | - |
| - | - |
| - | - |
| - | - |
| - | - |
| - | - |
| - | - |
| - | - |
| - | - |
| - | - |
The chart is not accessible to screen readers. Please switch to the table view to access the data.
Download
Source
Source
Release date
August 2023
More information
Region
India
Survey time period
FY 2013 to January 2023
Special properties
includes 10 management properties with 35 screens and 8,360 seats
Supplementary notes
In India, the financial year (FY) starts on April 1st and ends on March 31st. For example, FY 2022 started in April 2021 and ended in March 2022.
Citation formats