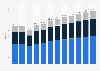
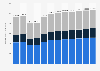
| Characteristic | Share of respondents |
|---|---|
| - | - |
| - | - |
| - | - |
| - | - |
| - | - |
| - | - |
| - | - |
The chart is not accessible to screen readers. Please switch to the table view to access the data.
Download
Source
Sources
Release date
October 2022
More information
Region
Worldwide
Survey time period
July 13 to September 9, 2022
Number of respondents
432 respondents
Special properties
Apparel, footwear, and accessories executives
Supplementary notes
The breakdown of respondents is as follows:
21 percent C-suite, 30 percent management, 32 percent top management.
12 percent wholesalers, 16 percent brands, 17 percent factories/manufacturers, 17 percent retailers (of which 34 percent were specialty stores, 27 percent department stores, 22 percent DTC or pure-play retailers.)
22 percent had apparel as their company鈥檚 primary product category, 20 percent footwear, 18 percent accessories, with the balance in fabrics, trims and fibers.
61 percent had gross sales or revenue of less than 500 million U.S. dollars, 22 percent 500 million to two billion dollars and nine percent two billion dollars or more.
The source does not provide a geographical breakdown of respondents.
Citation formats