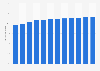
| Characteristic | Women | Men |
|---|---|---|
| University of Oxford (UK) | 52% | 48% |
| Massachusets Institute of Technology (US) | 43% | 57% |
| Princeton University (US) | 47% | 53% |
| University of Cambridge (UK) | 50% | 50% |
| Harvard University (US) | 53% | 47% |
| Stanford Unviersity (US) | 48% | 52% |
| California Institute of Technology (US) | 39% | 61% |
| Imperial College London (UK) | 43% | 57% |
| University of California, Berkeley (US) | 53% | 47% |
| Yale Unviersity (US) | 53% | 47% |
| ETH Zurich (Switzerland) | 33% | 67% |
| Tsinghua University (China)* | 34% | 66% |
| Peking University (China)* | 46% | 54% |
| University of Pennsylvania (US) | 55% | 45% |
| University of Chicago (US) | 47% | 53% |
| Johns Hopkins University (US) | 54% | 46% |
| National Unviersity of Singapore | 49% | 51% |
| Cornell University (US) | 53% | 47% |
| University of California, Los Angeles (US) | 57% | 43% |
| Columbia University (US)** | - | - |
The chart is not accessible to screen readers. Please switch to the table view to access the data.
Loading statistic...
Download
Source
Sources
Release date
September 2025
More information
Region
Worldwide
Survey time period
Autumn 2025
Supplementary notes
*based on World University Rankings 2022
**not stated
Citation formats