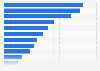
| Characteristic | Percentage of respondents |
|---|---|
| - | - |
| - | - |
| - | - |
| - | - |
| - | - |
| - | - |
| - | - |
| - | - |
| - | - |
| - | - |
The chart is not accessible to screen readers. Please switch to the table view to access the data.
Download
Source
Source
Release date
October 2022
More information
Region
United States
Survey time period
September 27 to October 3, 2022
Number of respondents
1,014 respondents
Special properties
Halloween celebrators
Supplementary notes
Survey respondents were asked to what extent they expected inflation and COVID-19 to impact their holiday plans.
Citation formats