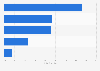
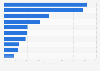
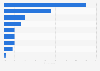
| Characteristic | Increased | Increased somewhat | No change | Declined somewhat | Declined | Did not use |
|---|---|---|---|---|---|---|
| - | - | - | - | - | - | - |
| - | - | - | - | - | - | - |
| - | - | - | - | - | - | - |
| - | - | - | - | - | - | - |
| - | - | - | - | - | - | - |
The chart is not accessible to screen readers. Please switch to the table view to access the data.
Download
Source
Sources
Release date
March 2022
More information
Region
Japan
Survey time period
April 2020 to December 2021
Number of respondents
2,543*
Age group
20-74 years**
Special properties
compared to consumer's behavior in January 2020; only one answer possible
Method of interview
Online panel
Supplementary notes
Respondents were asked about their use of food delivery services compared to pre-COVID-19 pandemic times (January 2020).
*The number of respondents in the surveys prior to December 2021 is:
April and June 2020: 2,062
December 2020: 2,069
July 2021: 2,582.
**In all prior surveys, the age of respondents was 20 to 69 years.
Citation formats