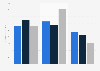
| Characteristic | Share of employees |
|---|---|
| - | - |
| - | - |
| - | - |
| - | - |
| - | - |
| - | - |
The chart is not accessible to screen readers. Please switch to the table view to access the data.
Download
Source
Sources
Release date
May 2022
More information
Region
United States
Survey time period
Q4 2021
Number of respondents
1,336 respondents
Supplementary notes
The survey was conducted among 1,780 operating, non-satellite television stations. Valid responses came from 1,336 television stations.
Question: How is the coronavirus affecting your TV newsroom today?
Citation formats