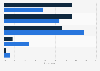
| Characteristic | Share of use multiple times per day |
|---|---|
| - | - |
| - | - |
| - | - |
| - | - |
| - | - |
| - | - |
| - | - |
| - | - |
| - | - |
| - | - |
The chart is not accessible to screen readers. Please switch to the table view to access the data.
Download
Source
Source
Release date
January 2020
More information
Region
Thailand
Survey time period
October 10 to October 25, 2019
Number of respondents
500 respondents
Special properties
survey conducted with Wunderman Thompson's propritary online research tool (SONARTM)
Supplementary notes
Original question: "On average, how often, if at all, do you use these devices?"
Citation formats