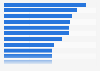
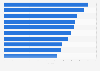
| Title | Difference from average market demand (1x) |
|---|---|
| - | - |
| - | - |
| - | - |
| - | - |
| - | - |
| - | - |
| - | - |
| - | - |
| - | - |
| - | - |
| - | - |
| - | - |
| - | - |
| - | - |
| - | - |
| - | - |
| - | - |
| - | - |
| - | - |
| - | - |
The chart is not accessible to screen readers. Please switch to the table view to access the data.
Download
Source
Source
Release date
May 2023
More information
Region
Brazil
Survey time period
2022
Supplementary notes
The source adds the following information: "The total audience demand being expressed for a title across all platforms in a market, compared to the average TV show. Audience demand reflects the desire, engagement and viewership, weighted by importance; so a stream/download is a higher expression of demand than a 'like'/comment. A difference of 1x represents the market average and 10x means a series is ten times more in demand than the average TV show in this market."
Citation formats