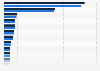
| Characteristic | GDP in million GDP (CVM 2022)* |
|---|---|
| Inner London - West | 263,674 |
| Inner London - East | 139,854 |
| Berkshire, Buckinghamshire and Oxfordshire | 120,171 |
| Surrey, East and West Sussex | 109,198 |
| Greater Manchester | 101,228 |
| West Midlands | 85,267 |
| Outer London - West and North West | 78,435 |
| West Yorkshire | 74,769 |
| Hampshire and Isle of Wight | 74,477 |
| Bedfordshire and Hertfordshire | 70,804 |
| Derbyshire and Nottinghamshire | 63,783 |
| Leicestershire, Rutland and Northamptonshire | 60,224 |
| Northern Ireland | 57,996 |
| Essex | 57,140 |
| Kent | 56,508 |
| Northumberland, Durham and Tyne & Wear | 54,027 |
| West Central Scotland | 52,711 |
| Gloucestershire and Wiltshire | 51,059 |
| East Central Scotland | 49,439 |
| Herefordshire, Worcestershire and Warwickshire | 49,303 |
| Outer London - East and North East | 47,132 |
| North Somerset, Somerset and Dorset | 46,664 |
| Merseyside | 45,287 |
| Shropshire and Staffordshire | 45,139 |
| Lancashire | 44,965 |
| West of England | 43,447 |
| South East Wales | 43,149 |
| Cheshire | 42,204 |
| Outer London - South | 40,018 |
| South Yorkshire | 36,523 |
| Cambridgeshire and Peterborough | 34,532 |
| Devon | 34,518 |
| North Yorkshire | 29,060 |
| East Yorkshire and Northern Lincolnshire | 27,754 |
| Eastern Scotland | 26,130 |
| Norfolk | 25,378 |
| Southern Scotland | 24,675 |
| Suffolk | 23,576 |
| Mid and South West Wales | 22,462 |
| Lincolnshire | 20,385 |
| North Wales | 19,740 |
| North Eastern Scotland | 18,705 |
| Tees Valley | 17,474 |
| Highlands and Islands | 15,700 |
| Cumbria | 15,421 |
| Cornwall and Isles of Scilly | 15,283 |
The chart is not accessible to screen readers. Please switch to the table view to access the data.
Loading statistic...
Download
Source
Source
Release date
April 2025
More information
Region
United Kingdom
Survey time period
2023
Supplementary notes
The regions displayed correspond to the International Territorial Level (ITL) level 2 sub-divisions of the United Kingdom.
*GDP is displayed in real terms (seasonally adjusted chained volume measure with 2022 as the reference year)
This statistic is using original data from the Office for National Statistics and includes copyright material from 漏 Crown, licensed under the聽.
Citation formats