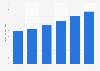


| Characteristic | Share of respondents |
|---|---|
| Sales | 62% |
| Marketing | 57% |
| Finance | 53% |
| IT | 41% |
| Legal | 39% |
| Operations | 35% |
| Human resources | 28% |
The chart is not accessible to screen readers. Please switch to the table view to access the data.
Loading statistic...
Download
Source
Sources
Release date
August 2020
More information
Region
North America, Europe, APAC
Survey time period
June 2020
Number of respondents
450 respondents
Special properties
senior IT and business decision makers*
Method of interview
Online survey
Supplementary notes
*Respondents are responsible for digital document processing at their organizations.
Respondents represent a range of company sizes, from small (2 to 99 employees) to global (more than 20,000 employees).
Industries represented are financial services and/or insurance (20%), local or national government (11%), higher education (20%), life sciences (20%), state government (9%), other (20%).
Respondent departments are finance/accounting (15%), human resources/training (9%), IT (32%), marketing/advertising (12%), operations (15%), sales (5%), legal (6%), product development and technology (6%).
Citation formats



