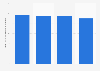
| Characteristic | Number of people employed in thousands |
|---|---|
| Q4 2022 | 3,500 |
| Q3 2022 | 3,398 |
| Q2 2022 | 3,454 |
| Q1 2022 | 3,393 |
| Q4 2021 | 3,487 |
| Q3 2021 | 3,379 |
| Q2 2021 | 3,407 |
| Q1 2021 | 3,429 |
| Q4 2020 | 3,433 |
| Q3 2020 | 3,512 |
| Q2 2020 | 3,405 |
| Q1 2020 | 3,566 |
| Q4 2019 | 3,566 |
| Q3 2019 | 3,544 |
| Q2 2019 | 3,528 |
| Q1 2019 | 3,520 |
| Q4 2018 | 3,508 |
| Q3 2018 | 3,503 |
| Q2 2018 | 3,498 |
The chart is not accessible to screen readers. Please switch to the table view to access the data.
Loading statistic...
Download
Source
Source
Release date
February 2023
More information
Region
Tunisia
Survey time period
Q2 2018 to Q4 2022
Supplementary notes
Figures have been rounded.
Data have been retrieved from several publications released by the same source.
The source adds the following information: "It should be noted that field collection operations of the national population and employment survey first quarter of 2022 were disrupted by a strike agents. Only data for the month of March and the beginning January 2022 were collected. Therefore, the indicators for the first quarter of 2022 only reflect partially the situation of the labor market at the reference date."
Citation formats