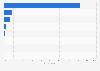
| Characteristic | In a registered marriage | In a non-registered marital relationship | In a relationship and living together | In a relationship | Nothing applicable |
|---|---|---|---|---|---|
| Men | 65.8% | 3.8% | 0.2% | 3.2% | 27% |
| Women | 65.7% | 3.8% | 0.5% | 5.3% | 24.6% |
| Neither men nor women | 29.2% | 0% | 4.2% | 16.7% | 50% |
| Cisgender | 65.8% | 3.8% | 0.4% | 4.4% | 25.7% |
| Transgender | 28.1% | 3.1% | 6.3% | 15.6% | 46.9% |
| Heterosexual | 66.8% | 3.8% | 0.5% | 4.3% | 24.6% |
| Homosexual, bisexual | 36% | 8.8% | 0% | 12.3% | 43% |
| Asexual | 16.3% | 6.1% | 0% | 2% | 75.5% |
| Have not determined/do not want to determine sexual orientation | 54.5% | 3.3% | 0.3% | 6.4% | 35.5% |
| I do not understand the question of sexual orientation | 72% | 2.8% | 0% | 2.8% | 22.4% |
The chart is not accessible to screen readers. Please switch to the table view to access the data.
February 2024
Japan
February 1 to 28, 2023
5,339 respondents
18-69 years
Online survey
5,339 respondents reported their gender identity and sexual orientation.
Sample size based on the responses:
[By gender identity]
Men n=2,304
Women n=2,971
Neither men nor women n=24
Unspecified n=40
[Cis/transgender]
Cisgender n=5,267
Transgender n=32
[By sexual orientation]
Heterosexual n=4,218
Homosexual, bisexual n=114
Asexual n=49
Have not determined/do not want to determine sexual orientation n=299
I do not understand the question of sexual orientation n=603
Unspecified n=56
Missing or exceeding percentage points to 100 percent are probably due to rounding.
The source does not indicate whether the LGBTQ+ individuals stating to be married are in same-sex relationships or not. As same-sex marriage is not legally recognized in Japan as of February 2024, married LGBTQ+ individuals might either be married to a spouse of the opposite sex or might be referring to a same-sex marriage conducted outside of Japan.