| Characteristic | Usage score |
|---|---|
| - | - |
| - | - |
| - | - |
| - | - |
| - | - |
| - | - |
| - | - |
The chart is not accessible to screen readers. Please switch to the table view to access the data.
Download
Source
Source
Release date
March 2020
More information
Region
Italy
Survey time period
January 3-21, 2020
Number of respondents
500*
Age group
18 years and older
Special properties
Italian gamers
Supplementary notes
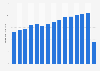
The survey question was phrased by the source as follows: "How much of your time playing video games is spent playing each of the following types of games?"
Answers based on a scale of 0 to 4, where 0 indicated that the no time was dedicated to the game, and 4 meaning that a lot of time was dedicated to it.
*The source specifies that data were collected through "consumer panels in France, Germany, India, Italy, Japan, Singapore, South Korea, the United Kingdom, and the U.S. Approximately 500 responses were collected from each country for a total of 4,500 global responses".
Citation formats