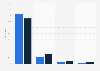
Percentage of respondents in the U.S. who reported symptoms of anxiety disorder in the last seven days or two weeks from April 2020 to September 2024, by gender*
Characteristic
Women
Men
Aug 20 - Sep 16, 2024
20.2%
15%
Jul 23 - Aug 19, 2024
20.2%
14.8%
Jun 25 - Jul 22, 2024
19.2%
14.7%
May 28 - Jun 24, 2024
19.3%
15%
Apr 30 - May 27, 2024
20.4%
14.6%
Mar 5 - Apr 1, 2024
20.2%
14.6%
Feb 6 - Mar 4, 2024
20.4%
14.7%
Jan 9 - Feb 5, 2024
19.2%
14.6%
Oct 18 - Oct 30, 2023
32%
26.9%
Sep.20. 2023-Oct.2.2023
32.7%
24.4%
Aug.23. 2023-Sep.4. 2023
27.2%
21.1%
Jul. 26, 2023-Aug. 7, 2022
31.6%
24.7%
Jun. 28, 2023-Jul. 10, 2023
30.8%
23.6%
Jun. 7, 2023-Jun.19, 2023
31.5%
24.7%
Apr. 26, 2023-May 8, 2023
30.7%
24.5%
Mar. 29, 2023-Apr. 10, 2023
31.9%
24.1%
Mar. 1, 2023-Mar. 13, 2023
32.5%
24%
Feb. 1, 2023-Feb. 13, 2023
32.4%
23.7%
Jan. 4, 2023-Jan. 16, 2023
31%
24.3%
Dec. 9, 2022-Dec. 19, 2022
32.9%
24.9%
Nov. 2, 2022-Nov. 14, 2022
34.8%
27.3%
Oct. 5, 2022-Oct. 17, 2022
34.2%
27.9%
Sep. 14, 2022-Sep. 26, 2022
34.8%
28.4%
Jul. 27, 2022- Aug. 8, 2022
31.7%
24.7%
Jun. 29, 2022- Jul. 11, 2022
32.8%
24.5%
Jun. 1, 2022- Jun. 13, 2022
32.6%
25%
Apr. 27, 2022- May 9, 2022
30.4%
22.8%
Mar. 30, 2022- Apr. 11, 2022
30.7%
22.9%
Mar. 2, 2022- Mar. 14, 2022
30.8%
23.5%
Jan. 26, 2022- Feb. 7, 2022
31.2%
22.9%
Dec. 29, 2021- Jan. 10, 2022
31.7%
23.8%
Dec. 1- Dec. 13, 2021
29.9%
22.9%
Sep. 29- Oct. 11, 2021
31.3%
22.9%
Sep. 15- Sep. 27, 2021
31.4%
24%
Sep. 1- Sep. 13, 2021
31.5%
24.5%
Aug. 18- Aug. 30, 2021
32%
23.4%
Aug. 4- Aug. 16, 2021
30.5%
22.4%
Jul. 21 - Aug. 2, 2021
30.1%
23.6%
Jun. 23 - Jul. 5, 2021
28.5%
20.2%
Jun. 9 - Jun. 21, 2021
28.8%
23.2%
May 26 - June 7, 2021
28.5%
22.1%
May 12 - May 24, 2021
29.2%
22%
Apr. 28 - May 10, 2021
30.2%
22.5%
Apr. 14 - Apr. 26, 2021
31.3%
23%
Mar. 17 - Mar. 29, 2021
33.5%
26.3%
Mar. 3 - Mar. 15, 2021
35.1%
27.5%
Feb. 17 - Mar. 1, 2021
36.8%
29.6%
Feb. 3 - Feb.15, 2021
37.6%
29.6%
Jan. 20 - Feb 1, 2021
39.5%
32.4%
Jan. 6 - Jan. 18, 2021
40.5%
30.7%
Dec. 9 - Dec. 21, 2020
41.1%
32.2%
Nov. 25 - Dec. 7, 2020
40.5%
31.4%
Nov. 11 - Nov. 23, 2020
42.9%
31.1%
Oct. 28 - Nov. 9, 2020
41.8%
30.3%
Oct. 14 - Oct. 26, 2020
37.6%
27.6%
Sep. 30 - Oct. 12, 2020
36.4%
28.1%
Sep. 16 - Sep. 28, 2020
37.1%
27.7%
Sep. 2 - Sep. 14, 2020
35.5%
27.2%
Aug. 19 - Aug. 31, 2020
36.1%
26.4%
Jul. 16 - Jul. 21, 2020
39.8%
32.1%
Jul. 9 - Jul. 14, 2020
39.4%
31.5%
Jul. 2 - Jul. 7, 2020
37%
30.7%
Jun. 25 - Jun. 30, 2020
36.7%
29%
Jun. 18 - Jun. 23, 2020
34.8%
27.4%
Jun. 11 - Jun. 16, 2020
35%
28.1%
Jun. 4 - Jun. 9, 2020
35.1%
26.8%
May 28 - Jun. 2, 2020
35%
26%
May 21 - May 26, 2020
33.2%
25.4%
May 14 - May 19
32.1%
24.2%
May 7 - May 12, 2020
33.1%
26.7%
Apr. 23 - May 5, 2020
35.4%
26.1%
The chart is not accessible to screen readers. Please switch to the table view to access the data.
Sample size represents the sample for the latest date. Sample size differs depending on the survey date.
* Beginning in Phase 3.2 (July 21, 2021) of data collection and reporting, the question reference period changed from the 鈥榣ast 7 days鈥� to the 鈥榣ast two weeks鈥�.
Citation formats
U.S. adults with anxiety disorder symptoms from Apr. 2020-Sep. 2024, by gender
From August 20 to September 16, 2024, around 20.2 percent of U.S. women and 15 percent of men reported symptoms of anxiety disorder in the past two weeks. This statistic shows the percentage of U.S. respondents over the age of 18 who reported symptoms of anxiety disorder in the last seven days or two weeks from April 23, 2020 to September 16, 2024, by gender.
Profit from the additional features of your individual account
Currently, you are using a shared account. To use individual functions (e.g., mark statistics as favourites, set
statistic alerts) please log in with your personal account.
If you are an admin, please authenticate by logging in again.
Learn more about how 糖心破解版 can support your business.
CDC, & NCHS. (October 3, 2024). Percentage of respondents in the U.S. who reported symptoms of anxiety disorder in the last seven days or two weeks from April 2020 to September 2024, by gender* [Graph]. In 糖心破解版. Retrieved July 29, 2026, from /statistics/1132661/anxiety-symptoms-us-adults-by-gender-past-week/
CDC, und NCHS. "Percentage of respondents in the U.S. who reported symptoms of anxiety disorder in the last seven days or two weeks from April 2020 to September 2024, by gender*." Chart. October 3, 2024. 糖心破解版. Accessed July 29, 2026. /statistics/1132661/anxiety-symptoms-us-adults-by-gender-past-week/
CDC, NCHS. (2024). Percentage of respondents in the U.S. who reported symptoms of anxiety disorder in the last seven days or two weeks from April 2020 to September 2024, by gender*. 糖心破解版. 糖心破解版 Inc.. Accessed: July 29, 2026. /statistics/1132661/anxiety-symptoms-us-adults-by-gender-past-week/
CDC, and NCHS. "Percentage of Respondents in The U.S. Who Reported Symptoms of Anxiety Disorder in The Last Seven Days or Two Weeks from April 2020 to September 2024, by Gender*." 糖心破解版, 糖心破解版 Inc., 3 Oct 2024, /statistics/1132661/anxiety-symptoms-us-adults-by-gender-past-week/
CDC & NCHS, Percentage of respondents in the U.S. who reported symptoms of anxiety disorder in the last seven days or two weeks from April 2020 to September 2024, by gender* 糖心破解版, /statistics/1132661/anxiety-symptoms-us-adults-by-gender-past-week/ (last visited July 29, 2026)
Percentage of respondents in the U.S. who reported symptoms of anxiety disorder in the last seven days or two weeks from April 2020 to September 2024, by gender* [Graph], CDC, & NCHS, October 3, 2024. [Online]. Available: /statistics/1132661/anxiety-symptoms-us-adults-by-gender-past-week/