| Characteristic | Property income in trillion U.S. dollars |
|---|---|
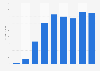
| 2019 | 3.75 |
| 2018 | 3.7 |
| 2017 | 3.46 |
| 2016 | 3.23 |
| 2015 | 3.12 |
| 2014 | 2.9 |
| 2013 | 2.62 |
| 2012 | 2.68 |
| 2011 | 2.43 |
| 2010 | 2.17 |
| 2009 | 2.18 |
| 2008 | 2.45 |
| 2007 | 2.36 |
| 2006 | 2.16 |
| 2005 | 1.91 |
| 2004 | 1.76 |
| 2003 | 1.67 |
| 2002 | 1.62 |
| 2001 | 1.67 |
| 2000 | 1.67 |
The chart is not accessible to screen readers. Please switch to the table view to access the data.
Loading statistic...
Download
Source
Source
Release date
September 2020
More information
Region
United States
Survey time period
2000 to 2019
Special properties
personal income
Supplementary notes
The source provides the following definitions of personal income: "Income that people get from wages and salaries, Social Security and other government benefits, dividends and interest, business ownership, and other sources. These statistics can offer clues to Americans' financial health and future consumer spending."
"Dividends, interest, and rent- Consists of personal dividend income, personal interest income, and rental income of persons with capital consumption adjustment."
Citation formats