| Characteristic | During the outbreak | One month after the outbreak | One to three months after the outbreak | Over three months after the outbreak |
|---|---|---|---|---|
| - | - | - | - | - |
| - | - | - | - | - |
| - | - | - | - | - |
| - | - | - | - | - |
| - | - | - | - | - |
| - | - | - | - | - |
| - | - | - | - | - |
| - | - | - | - | - |
| - | - | - | - | - |
| - | - | - | - | - |
| - | - | - | - | - |
| - | - | - | - | - |
| - | - | - | - | - |
The chart is not accessible to screen readers. Please switch to the table view to access the data.
Download
Source
Source
Release date
March 2020
More information
Region
China
Survey time period
February 17, 2020
Number of respondents
1,889 respondents
Special properties
enterprises
Method of interview
Online survey
Supplementary notes
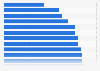
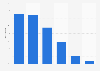
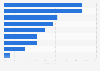
The data behind the index in this graph is a comparison with user consumption behavior in 2019. The index range is one to negative one. A value of zero indicates no difference to 2019. The higher the value, the higher the growth expectations.
The period of the outbreak was January 20 to February 17.
The end of the outbreak was defined as "the number of confirmed diagnosis is 0".
Citation formats