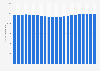
| Characteristic | Much more likely | Somewhat more likely | Somewhat less likely | Much less likely | Don't know/ No opinion |
|---|---|---|---|---|---|
| - | - | - | - | - | - |
| - | - | - | - | - | - |
| - | - | - | - | - | - |
| - | - | - | - | - | - |
| - | - | - | - | - | - |
| - | - | - | - | - | - |
| - | - | - | - | - | - |
| - | - | - | - | - | - |
| - | - | - | - | - | - |
The chart is not accessible to screen readers. Please switch to the table view to access the data.
Download
Source
Sources
Release date
April 2020
More information
Region
United States
Survey time period
April 23-26, 2020
Number of respondents
2,200 respondents
Age group
18 years and older
Method of interview
Online survey
Supplementary notes
Question: And if a movie theater did the following, would you be more or less likely to go to a movie within a month of your state passing White House benchmarks for re-opening the economy?
Citation formats