
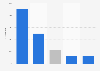
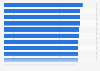


| Characteristic | I will start to buy it online | Never bought and won't start to buy it online | I will stop buying it online | Reduce the frequency of online purchase | Keep the frequency of online purchase | Increase the frequency of online purchase |
|---|---|---|---|---|---|---|
| Staple goods | 17% | 40% | 4% | 5% | 13% | 22% |
| Pharmaceutical products | 15% | 50% | 4% | 5% | 11% | 15% |
| Durable goods | 8% | 36% | 12% | 12% | 22% | 10% |
| Clothing or shoes | 7% | 37% | 12% | 15% | 21% | 9% |
| Technological products | 6% | 36% | 9% | 15% | 25% | 8% |
| Books | 6% | 56% | 7% | 7% | 18% | 7% |
| Services | 8% | 46% | 9% | 10% | 22% | 7% |
| Travel | 5% | 40% | 15% | 16% | 19% | 4% |
| Games & videogames | 4% | 64% | 6% | 8% | 13% | 4% |
The chart is not accessible to screen readers. Please switch to the table view to access the data.
Loading statistic...
Download
Source
Source
Release date
April 2020
More information
Region
Chile
Survey time period
March 30 and 31, and April 1, 2020
Number of respondents
508 respondents*
Age group
18 years and older
Supplementary notes
* Only in the cities of Antofagasta, Concepci贸n, Coquimbo, La Serena, Puerto Montt, Santiago, Talcahuano, Valpara铆so, and Vi帽a de Mar.
Percentage points missing to or exceeding 100 percent are probably due to rounding.
The question was posed as follows: "驴En qu茅 medida piensa cambiar tus h谩bitos de compra online de las siguientes categor铆as de productos en los pr贸ximos d铆as?".
Citation formats



