| Characteristic | Sales growth |
|---|---|
| - | - |
| - | - |
| - | - |
The chart is not accessible to screen readers. Please switch to the table view to access the data.
Download
Source
Sources
Release date
January 2020
More information
Region
Indonesia
Survey time period
2017 to 2019
Special properties
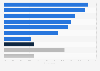
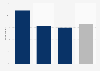
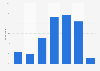
sales growth compares sales during the festive period with that of pre-festive periods of each year
Supplementary notes
The data for pre-festive period in 2019 was taken as the average of four weekly data in the last six-month period from November 18 to April 19.
The data for festive period in 2019 was taken as the average of four weekly data for the period May to June 2019.
Data for 2017 found in prior report from Kantar Worldpanel.
Citation formats