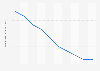
| Characteristic | Brazil | Great Britain | India | Italy | Sweden | United States | South Africa |
|---|---|---|---|---|---|---|---|
| Feb 29, 2020 | -2% | -2% | 0% | -16% | 5% | 7% | 8% |
| Mar 31, 2020 | -58% | -72% | -73% | -79% | -37% | -49% | -78% |
| Apr 30, 2020 | -46% | -69% | -64% | -71% | -35% | -47% | -73% |
| May 31, 2020 | -47% | -45% | -46% | -32% | -12% | -30% | -58% |
| Jun 30, 2020 | -38% | -50% | -38% | -29% | -30% | -30% | -46% |
| Jul 31, 2020 | -29% | -37% | -37% | -23% | -27% | -28% | -44% |
| Aug 31, 2020 | -27% | -43% | -35% | -28% | -24% | -32% | -42% |
| Sep 30, 2020 | -21% | -40% | -24% | -13% | -25% | -33% | -33% |
| Oct 31, 2020 | -7% | -44% | -21% | -27% | -23% | -23% | -22% |
| Nov 30, 2020 | -13% | -49% | -20% | -43% | -41% | -39% | -23% |
| Dec 31, 2020 | -32% | -67% | -4% | -62% | -61% | -42% | -43% |
| Jan 31, 2021 | -24% | -63% | -6% | -50% | -44% | -39% | -44% |
| Feb 28, 2021 | -29% | -55% | -3% | -32% | -33% | -29% | -27% |
| Mar 31, 2021 | -34% | -47% | -7% | -40% | -37% | -29% | -20% |
The chart is not accessible to screen readers. Please switch to the table view to access the data.
Loading statistic...
Download
Source
More information
Region
Worldwide
Survey time period
February 29, 2020 to March 31, 2021
Supplementary notes
Please download the CSV file to retrieve data.
The source uses Google Maps to compare current activities at public transport hubs (such as subway, bus, and train stations) to 'normal activity'; the baseline is the median value for the corresponding day of the week, during the period between January 3 and February 6, 2020.
Inclusion of data depends on user settings, connectivity, and whether it meets Google's privacy threshold, according to the source.
Citation formats