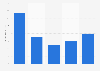
| Characteristic | Share of respondents |
|---|---|
| - | - |
| - | - |
| - | - |
| - | - |
| - | - |
| - | - |
| - | - |
| - | - |
| - | - |
| - | - |
| - | - |
The chart is not accessible to screen readers. Please switch to the table view to access the data.
Download
Source
Source
Release date
February 2021
More information
Region
North America
Survey time period
November and December 2020
Special properties
North American retailers
Method of interview
Online survey
Supplementary notes
The source notes that "survey respondents were from specialty soft goods (33%) and specialty hard goods (26%). The remainder fell into other categories such as general merchandise, grocery and QSR/restaurant."
The source does not provide information regarding the number of respondents surveyed in the methodology.
Citation formats