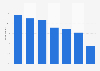


| Characteristic | Share of respondents |
|---|---|
| Restaurants | 54% |
| Tourism, leisure | 53% |
| Craftsmen troubleshooters/installers | 46% |
| Craftsmen of the construction industry | 45% |
| Medical | 38% |
| Paramedical | 34% |
| Non-food businesses | 37% |
| Car/motorcycle | 37% |
| Catering businesses | 36% |
| Retail Services | 36% |
| Banking/insurance | 36% |
| Other craftsmen | 35% |
| Beauty/wellness | 33% |
| Real estate agencies | 31% |
| Public | 31% |
| Business Services | 24% |
| Taxis | 21% |
| Driving schools | 21% |
| Farmers | 17% |
The chart is not accessible to screen readers. Please switch to the table view to access the data.
Loading statistic...
Download
Source
Sources
Release date
January 2018
More information
Region
France
Survey time period
June 19 - July 22, 2017
Number of respondents
2,003 respondents
Age group
18 and over
Method of interview
Computer-assisted web interviews (CAWI)
Supplementary notes
*The question was formulated by the source
as follows: "For each of the following activities, please indicate those for which you would like to have more internet reviews?"
Multiple answers were possible.
Citation formats



